Discover Weekly? Discover Anytime!
- Ashreet Sangotra
- Sep 10, 2020
- 11 min read

Updated: Oct 4, 2020
Introduction
If you use Spotify as your main music app, you definitely know about Discover Weekly! Every Monday you get a new playlist of 30 songs based on your listening history and likes. In my experience, Spotify has the best recommendations and is designed for discovering Music unique to your taste. I usually end up listening to Discover Weekly playlist on Monday itself.
With this blog I want to make an attempt to find out more songs that I like!

Pre-Requisites
The code usage in the blog will be limited. However a basic understanding on the following is recommended:
REST APIs
Matplotlib / Seaborn for plotting 2-D Data.
Pandas for Data Manipulation
Basic Classification Models. We will be using Logistic Regression, Support Vector Machines, Decision Trees, K-Neighours and Naive Bayes Classifier.
Advanced / Ensemble Models: We will be using RandomForest and XGBoost.
Over-sampling techniques for un-balanced Datasets - SMOTE Technique
Performance Metrics - mainly Precision and Recall Score.
For detailed code-work, you can check out my GitHub repo (link at the end of the post).
Overview
Until recently, my main Music App was Apple Music. So Apple Music still has the bulk of my music library.
Hence we will work with 2 Datasets - My Apple Music Library and my Spotify Library. Both of these libraries will have different data collection and cleaning techniques.

Do note, we are not looking at this problem as a typical recommender system task. We will be instead extracting certain features of songs, run classifiers and learn a model that we can later apply to a broader and separate Spotify dataset.
Both the datasets will lead to different and independent models. However the common strategy we will follow is:
Export libraries and import data in pandas
Use Spotify's API to extract audio features.
Label the songs.
Feature Selection and Engineering.
Train different Classifiers and evaluate performance.
Run the model on Spotify's main data to discover more songs.
The first 4 points compromise Data Collection and Cleaning. These steps will vary significantly for each dataset. Steps 5 and 6 would be quite similar as we would have standardised all the information by then.
Outline
We will divide the project into 4 sections. In each section and sub-section, we will make progress on each library.
A. Data Collection
Export Music Libraries
Extract Audio Features for each song using Spotify's API
Label songs
B. Data Cleaning
Feature Selection
Feature Engineering / Scaling
C. Model Building
Apple Music Dataset - Original and Balanced (SMOTE)
Spotify Music Dataset - Original and Balanced (SMOTE)
D. Model Evaluation and Tuning
Metric Selection
Model Tuning
E. Conclusions
Data Collection
1. Exporting Music Libraries
Our goal is to extract track names from each library and then use Spotify's API to get the audio-features for each track in the respective library.
Apple Music makes it easier to export libraries. Without much hassle you can get to a csv file. I won't dive into the steps. You can check them out in this Apple Discussion thread. The resulting csv covers all basic info for each song - from artist name, genre all the way till Comments, Equaliser, Work etc.
Since we are not interest in all this info, let's select the ones we would need - Name, Artist, Album, Year, Plays, Genre. An initial cleaned up version of this looks like below (the first 5 rows).

We will need some of this data when we fetch Audio Features for each track from Spotify's API later.
Spotify Music would be trickier if our end goal wasn't to collect info to later feed into a Spotify API. Since we will use a Spotify API later, the only info we need from my Spotify Library is the unique track IDs Spotify assigns to each track. Let's quickly see how to do that.

Just command + select all the songs you want. In our case - command + A for all songs in the library. Right click -> Share -> Copy Spotify URLs.
Paste these in a text or a csv file which can be imported directly into pandas.
An URL example for a track is spotify:track:6JjjXqCKZFl3dDfQQKn9qs. The alpha-numeric ID after 'track:' is the unique track ID (also known as Spotify ID) we are interested in. Import these into pandas and cleaning them up a bit, and we have the following.

2. Extract Audio Features for each song using Spotify's API
Spotify has an excelled platform for developers that allow you to extract tons of information about any song, artist etc.

We are interested in extracting Audio Features of each track. Here are the 13 audio features we are after: Danceability, Energy, Key, Loudness, Mode, Speechiness, Acousticness, Instrumentalness, Liveness, Valence, Tempo, Duration (ms), Time Signature.
For advanced use cases, Spotify provides in depth Audio Analysis data such as the segments, tatums, bars, beats, pitches, and more. We won't be using those this time. But you could definitely take those too and try running a Neural Network on it!
As for the Audio Features we will be using, here is Spotify's description for each feature and what exactly it represents. Would highly recommend reading that before moving ahead.
The Audio Features API GET command needs the Spotify ID (or the track ID) to get the information. We have Spotify IDs for our Spotify Library, but not our Apple Library. So we will have to follow different way to extract the info for each dataset (Library)
We have the name of the song and artist name from our Apple Music dataset. We will first run the GET command with the song and artist name and extract the Spotify ID. And then subsequently we will use this Spotify ID to extract the audio features.
As for our Spotify Music Library, we already have the track IDs. So we can get the audio features with just one GET command.
Going over the code-work for REST APIs is beyond the scope of this blog. If interested, you can find the code in my GitHub Repo (link at the bottom).
If you want to learn more about working with Spotify's API and see the interesting things you can do, check out this post here.
This is how the audio features section of the updated dataframe looks like:

Note: These are just the audio features we extracted. The dataframe has more columns from our earlier information collection steps, but can't be seen due to dimension restrictions of the image.
3. Label songs
By now, we have collected the audio features for each track and organized it. The next step is to label tracks as positive (1) and negative (0). Positive means songs I really like and. Negative is basically songs I don't listen much.
We will adopt a different approach for each Dataset. Apple Music easily allows you to view the number of Plays for each song. Also since I have used my Apple Music for a few years, the song ranking based on Plays is more mature and reflects quite accurately my taste in music. Here is a screenshot of my most played songs. On a side note, Queen for the win!

For our Apple Music Dataset, we will use 'Plays' value as 40 as the threshold. Songs with plays less than 40 will be labelled 0. And similarly songs with plays more than 40 will be labelled 1.
Subsequently, for our Spotify Library, I will label is manually. After labelling the data, here's how the distribution looks like for each dataset.

Our Apple Music Library is quite skewed, also called an imbalanced Dataset. Spotify Dataset is better distributed, but still a bit skewed. We will address this problem by using an over-sampling technique called SMOTE. More on that once we get to Model Building!
Note: Since our labelling strategies are different for each dataset, there's likely to be a significant difference in the model performance.
We have successfully collected the data and labelled it. Next we will clean it.
Data Cleaning
1. Feature Selection
Here are the columns present in out Apple Music DataSet:

'track_name' has no predictive power. Even though we can find some categories with 'artist_name' and 'genre' and thus try and see how they influence 'Label', the model won't generalise to a broader Spotify Data, as we can't take into account all possible artists and genres while training the model. The column 'plays' was used to determine the 'Labels', which we have already done. Also we won't have 'plays' info for new data we are trying to predict. The column 'year' doesn't provide accurate data, as it assigns date based on when a particular version of a song was released, and not the original release year.
We will be dropping the above mentioned columns.
We will use 'track_id' as the index for the dataset, as it's unique to each song. Here are the first 5 rows of the updated DataFrame.

Now let's have a look at the Spotify Dataset. Here are the columns.
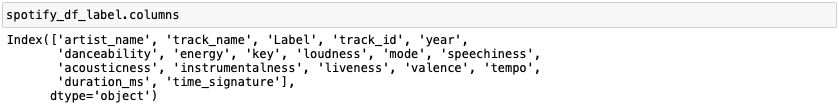
Similar to the Apple Library, we will drop 'artist_name', 'track_name' and 'year' columns. The 'track_id' will be set as index and 'Label' is our target column. The top 5 rows of the updated DataFrame:

2. Feature Engineering / Scaling
At this point both the datasets have been brought down to the same format with the same features. We have 10 continues features.
Let's look at their density plots to see how the distribution differs for the songs with Label 0 and Label 1.

We will scale 3 columns for our Apple Music Dataset - Loudness, Tempo and Duration. This combination of scaling has shown to produce better results.
Similarly let's have a look at the Density plots for out Spotify Dataset.

From a close look between the 2 plots, it's clear that Spotify Dataset has less variance between label 0 and label 1 of each feature.
For our Spotify Library, we will scale all the features by applying the StandardScaler() function from sklearn. Normalising all features has shown to produce better results for the Spotify dataset.
These are the updated data frames (first 5 rows):
Apple Library

Spotify Library

Model Building
Now that our data has been cleaned, we will proceed with fitting different classification models on our datasets.
Let's first take a look at how closely the feature variables are correlated amongst themselves and with the target variable.
As you you see below, the 'Label' row for Apple and Spotify both have extremely small correlation scores. Though Spotify data tends to do slightly better than Apple dataset.

From earlier we know that our datasets are not balanced, especially the Apple Music dataset. Hence we will be building our models with balanced datasets (using the SMOTE oversampling technique) as well as unbalanced datasets (dataset before applying SMOTE).
A problem with imbalanced classification is that there are too few examples of the minority class for a model to effectively learn the decision boundary. One way to solve this problem is to oversample the examples in the minority class.
Perhaps the most widely used approach to synthesising new examples is called the Synthetic Minority Oversampling TEchnique, or SMOTE for short.
You can read more about it here.
1. Apple Music Dataset: Original and Balanced (SMOTE)
We will use with 6 different classifiers - Logistic Regression, Support Vector Machines, K-Nearest Neighbours, Random Forest, Naive Bayes and Extreme Gradient (XGBoost).
After training and testing both versions of the Apple Music Dataset, here is a compiled output of the dataset, model and evaluation metrics.

The Accuracy when these models were run on the original or imbalanced dataset is quite high. But that doesn't mean the model is the best fit, as the dataset it extremely skewed.
For eg: The Logistic Regression on Original Data just predicted all values as '0', but still for 94% accuracy as 94% of the values in the dataset were labelled zero.
On the other hand the classifiers ran on SMOTE Dataset have lesser accuracy but seem to label better. We will talk more about this in the Model Evaluation section.
As we have applied SMOTE with the assumption of getting better results, here are feature importances for the Apple SMOTE dataset. They belong to the Random Forest Classifier.

2. Spotify Music Dataset: Original and Balanced (SMOTE)
Just like above I trained and tested these 6 models on the Spotify Dataset. Here is the output.

Here, the Accuracy scores of the Original and SMOTE datasets are more closer to each other as compared to the Apple Music Dataset. This makes sense as the Apple Data was more skewed than Spotify's.

We have recorded quite a few metrics - from Accuracy to ROC AUC Score. We will look at them in the next section to see which metric is key for our problem and how to improve it.
Model Evaluation and Tuning:
1. Metric Selection
Our goal with building a Music classifier is to increase the number of songs we like, out of all the recommended songs. Let's check which metric captures that goal.
As an example, we will look at the performance of Random Forest Classifier on Apple Music SMOTE Dataset. Here's the confusion matrix:

We can further derive the Accuracy to be 90.7%, Recall at 28.6% and Precision at 25%.
Recall tells us that - of all the songs that are actually positive, how many was the classifier able to correctly predict. On the other hand precision tells us that - of all the songs that were predicted by the classifier to be positive, how many were actually positive.
We can have high recall - meaning a lot of positive songs are predicted correctly, but that will also lead to many more false positives. We will end up with a situation where we have tons of songs predicted positive so the classifier can ensure that all songs that are actually positive are captured. This is okay if we don't mind sitting and listening to all songs and then picking the ones we like.
Since we will be running our model on a massive dataset, we want to make sure that we capture less of total songs, if it means that we can have more actual positive songs. Or in other words - as less false positives as possible. We want to increase the true positives and decrease the false positives. This ratio is captured in Precision.
Thus we will use Precision as our metric of choice. Our goal is to evaluate and tune the models to get as high of a Precision as possible.
2. Model Tuning
Instead of focusing on Hyper-parameter tuning, we will work on Threshold tuning. Hyper-parameter tuning is primarily meant for increasing accuracy. However since our goal is to increase Precision, tuning threshold values would be more beneficial.
The ideal (default) threshold is set at 0.5 for classifiers. When we increase the threshold, we expect total number of songs predicted as positive to reduce, as the probability threshold for positive class is increased, thus increasing precision. On the other extreme, we expect Recall to be high.
Let's start with our Apple Dataset. When we did the performance of different models earlier, we saw that the performance is worse for the Apple Data compared to the Spotify dataset. We will try to improve that a bit. I will focus on 4 classifiers instead of all 6. You can try tuning for the rest too.
We will work with balanced SMOTE data, as it allows us to capture a larger variance and it would regularise well.
Apple SMOTE Data

Here is the output in a tabular form:
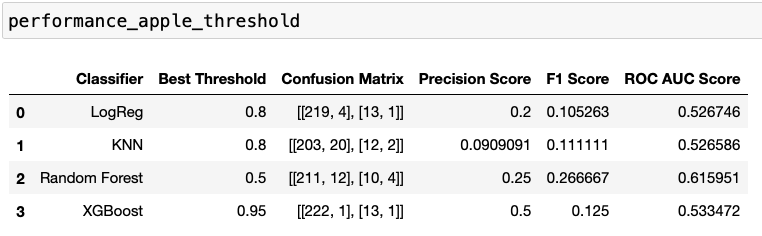
We were able to increase the Precision Scores for all classifiers expect Random Forest. As you can see from the graph, Random Forest takes it highest precision at the default threshold of 0.5
XGBoost gives us the best Precision Score. A precision a 0.5 simply implies that - of all the songs the classifier recommend, I will love 50% of them, and add it to my library. This is much better than the 3-4 songs I like for every 30 songs Discover Weekly recommends.
Let's go on to our Spotify SMOTE Dataset now.
Spotify SMOTE Data

Here is the output in a tabular form:

All Classifiers have improved their performance. Random Forest has improved it's precision score drastically. We are getting a 100% precision for threshold values between 0.75 - 0.85.
Ideally this would mean that we will love all songs this classifier would recommend.
However in practice, it won't translate to me liking all the recommended songs. But I can expect to like the vast majority of them!
Conclusions:
Before we start using our model, let's quickly go through some keys points:
The main difference between our Spotify and Apple Datasets was the labelling strategy. Even though labelling songs based on how frequently they were played seems like a decent strategy, it's still more effective to manually label, especially if the libraries are not too huge.
I focused on threshold tuning. You can try other hyper-parameter tuning techniques to improve the score further. Though it's less likely to get significant improvements.
Data Collection and Cleaning is still the most time consuming part.
There are a lot of topics that were covered through the post. I have added links throughout the post and quite a few towards the end under Further Reading and References. Feel free to go through those!
On an ending note, here's a screenshot of my Discover Anytime playlist! I ran it on a Kaggle Spotify dataset of 100K + songs with these audio features.

To check the codeword, visit my GitHub!
Further Reading:
1. Blog Post on Spotify API: https://stmorse.github.io/journal/spotify-api.html
2. SMOTE Technique: https://machinelearningmastery.com/smote-oversampling-for-imbalanced-classification/
3. Spotify API Audio Analysis: https://developer.spotify.com/documentation/web-api/reference/tracks/get-audio-analysis/
References:
1. Blog Cover Photo: Photo by Kaboompics.com from Pexels
2. Apple Discussion Thread: https://discussions.apple.com/thread/250182351
3. Spotify API Audio Features: https://developer.spotify.com/documentation/web-api/reference/tracks/get-audio-features/
4. Kaggle Spotify Dataset: https://www.kaggle.com/yamaerenay/spotify-dataset-19212020-160k-tracks


Comments